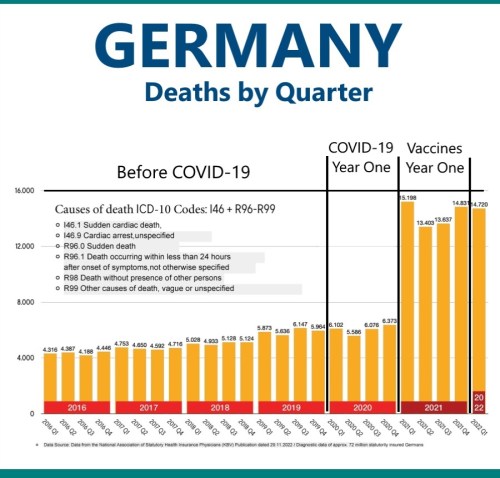
by WorldTribune Staff, June 13, 2023 A chart from Germany’s National Association of Statutory Health Insurance (KBV) that breaks down deaths by quarter from 2016 to the first quarter of 2022 …
Source: One chart says it all: How do you explain all these deaths?
Categories: Articole de interes general

Leave a comment